LifeMonitor Dashboard
The LifeMonitor Web App provides a graphical interface to the service, allowing to get a quick overview of the status of monitored workflows.
To do anything but see public workflows on the dashboard you must authenticate (i.e., “sign in”) with the LifeMonitor service by clicking on “Sign in” at the top right of the landing page. See the dedicated page for more details.
LifeMonitor Dashboard
The dashboard page is the main landing page when you access LifeMonitor. The dashboard includes:
- your workflows;
- the workflows to which you have subscribed.
Adding workflows
The most common way to add workflows to your dashboard is to register your own workflows, either through the LifeMonitor GitHub app or manually.
However, you can also add workflows by searching for them in LifeMonitor and subscribing to their test notifications.
Searching for workflows
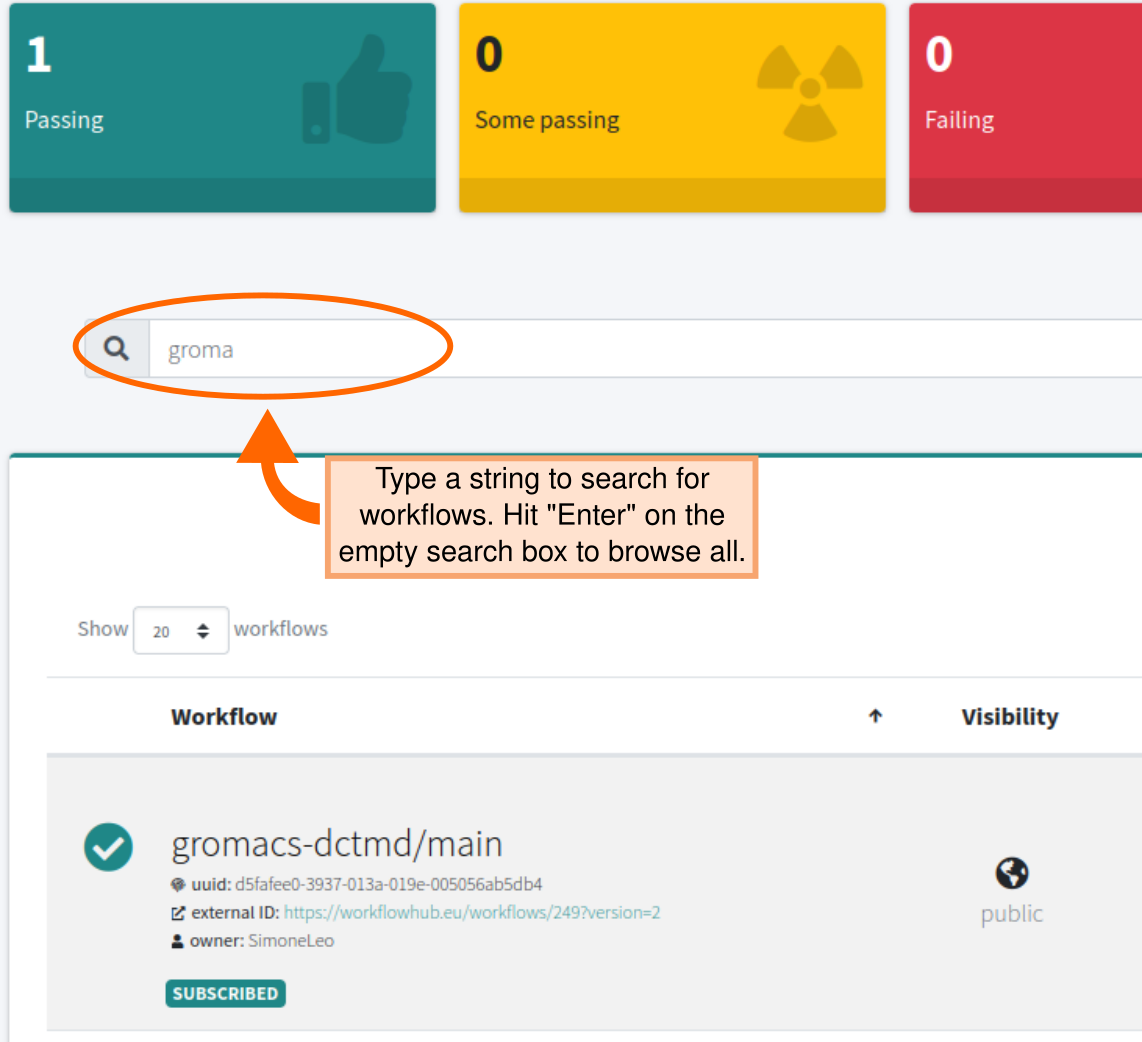
Enter a string in the search box at the top of the dashboard and LifeMonitor will list the workflows with names that contain the string you entered. Press “Enter” on an empty search box to browse the registered workflows to which you have access.

Subscribing to workflows
You can subscribe to other people’s public workflows. If you do, those workflows will appear on your dashboard and you will be notified when their test status changes (e.g., when they are fixed after a period of test failures).
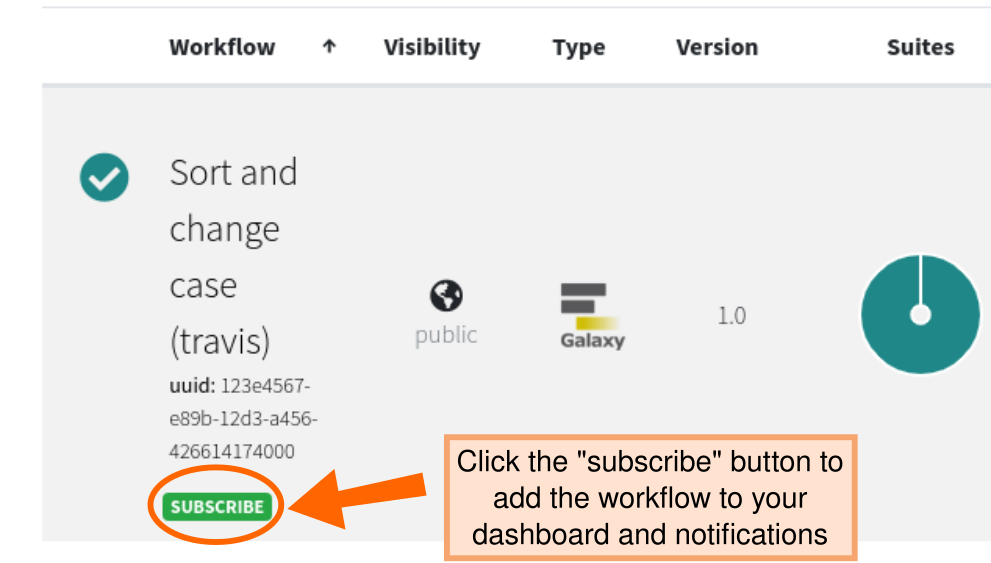
To subscribe, search for the workflow and click on its “Subscribe” button.

Summary table
At the top of the dashboard, an overall summary bar shows the number of workflows for each category of testing outcomes. You can click on a category to filter the workflow list.
| Category | Definition |
|---|---|
| Passing | all test suites were successful |
| Some passing | only part of the test suites are passing |
| Failing | test suites are all unsuccessful |
| Unavailable | no testing data available |

Workflow list
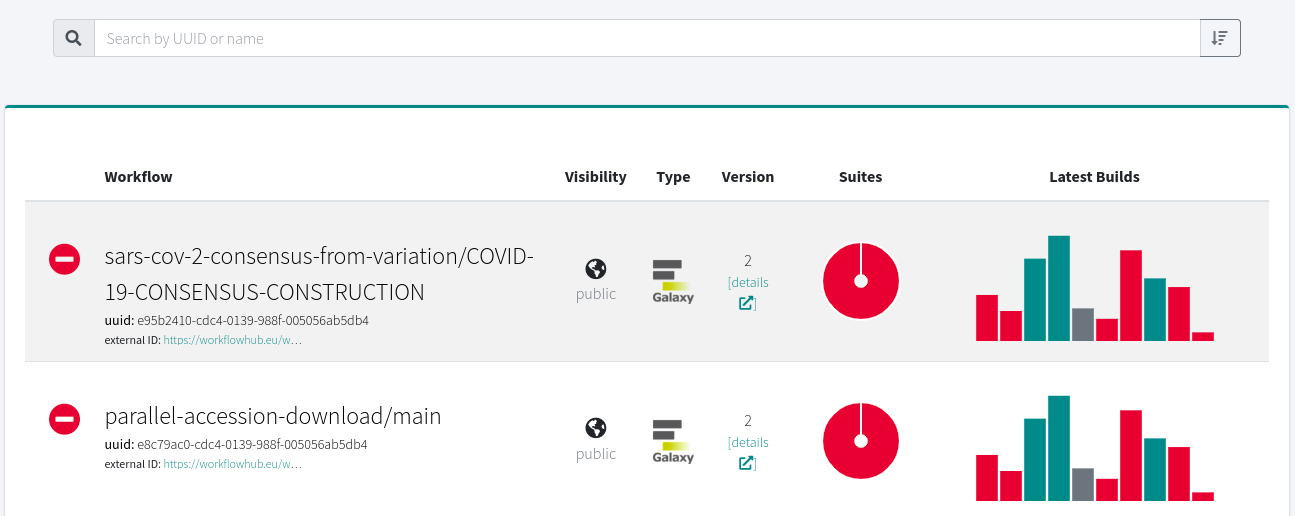
The main part of the dashboard is the list of monitored workflows reporting their detailed test statuses:

Each row begins with workflow metadata. From left to right:
- The workflow’s name, unique ID and external (registry) ID
- Name is configured during the registration process (e.g., extracted from RO-Crate, or inserted manually);
- The unique ID is generated by LifeMonitor;
- The external ID is available if the workflow’s record is matched to a record in the WorkflowHub registry (e.g., because it was imported from it).
- If available, additional metadata is also shown here, like workflow author, submitter, etc.
- The workflow’s visibility (public or private)
- only you can see private test results; anyone can see public test results.
- The workflow type (e.g., Galaxy, CWL)
- The workflow version
The Suites and Latest Builds columns report test results.
Suites: a pie chart showing the share of passing and failing test suites.
Latest Builds: A bar chart showing the duration and outcome of each individual test run.
- Green for passed; red for failed.
- The height of the bar is proportional to the time the pipeline took to execute.
- The 10 latest builds are shown.
From the workflow list, by clicking on either the workflow’s name/UUID or the pie chart you can dig down into more detailed reports about the status of test suites and the test instances where they are executed (see Key Concepts.
